


Respondent Demographics & Survey Methodology
The initial report written by Reitman Research & Strategy focused precisely on women and on underrepresented architects of color (UAC), a grouping that includes architects of color other than Asians (who were found to be overrepresented within the profession and thus were pulled out of the former grouping). For a detailed explanation of the UAC methodology, please see Initial Report & Methodology. The Diversity and Inclusion Committee embarked on an additional study of the data for two main purposes. First, the committee wished to create a base set of key takeaways, regardless of survey respondents’ ethnicity/race or gender, and to understand the workplace experience of AIA New York membership in general.
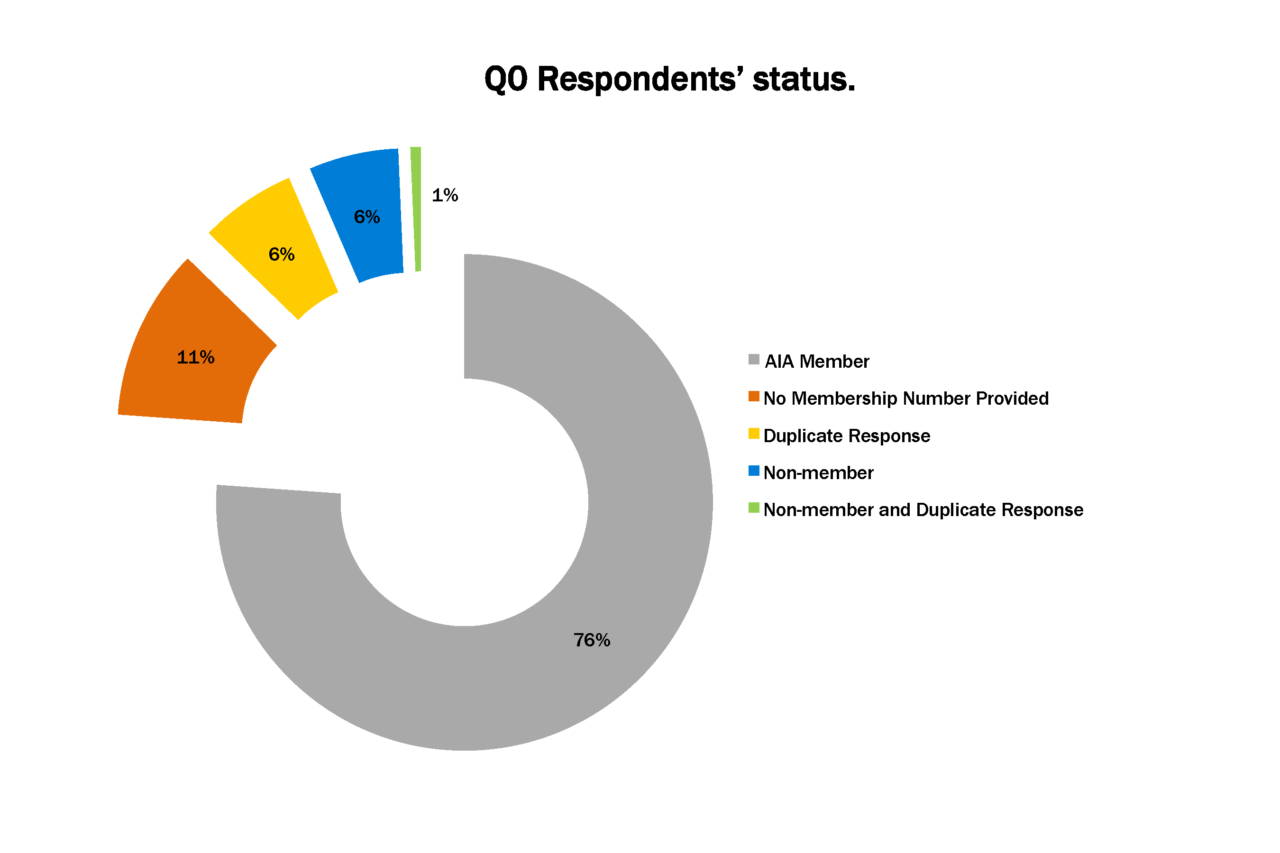
Only AIA Member responses are considered in the survey results. Nearly one quarter of all survey landings were not AIA members, did not provide a membership number, or took the survey multiple times.
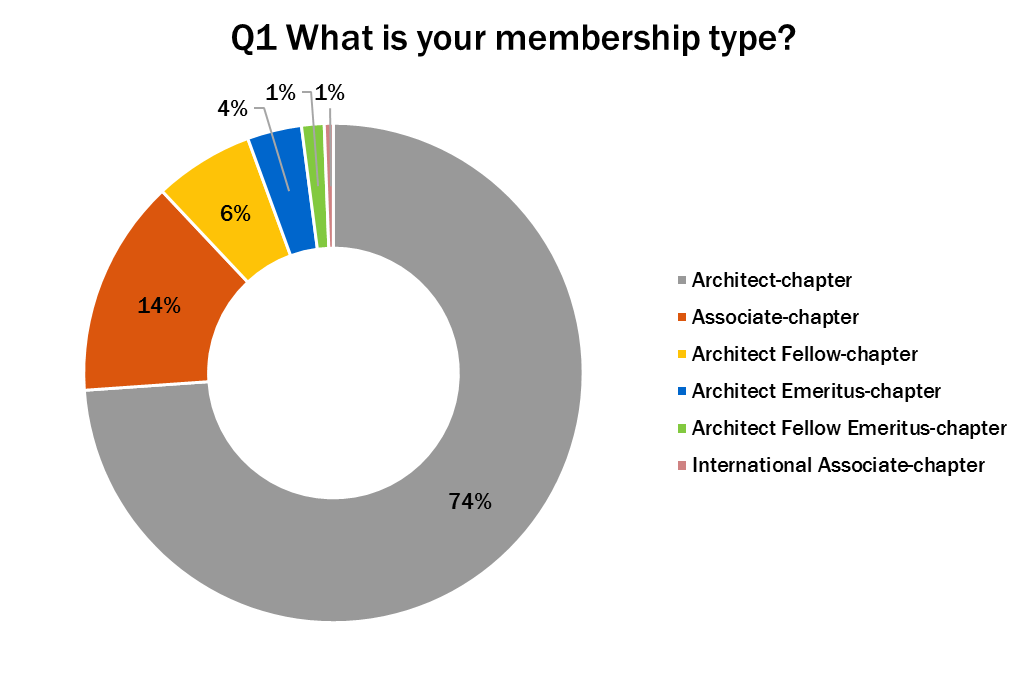
The majority of respondents were AIA Architect members, followed by AIA Associate members.
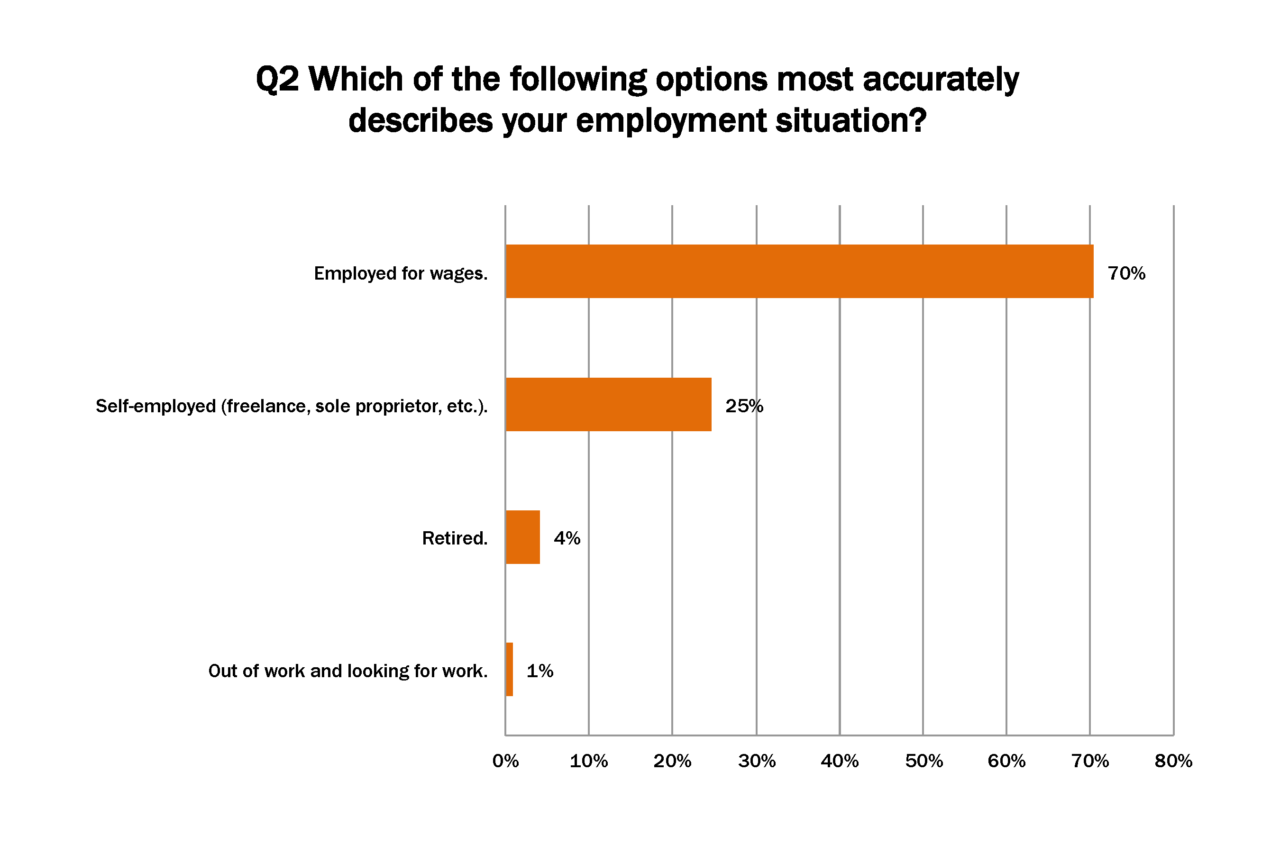
95% of survey respondents were employed at the time of the survey taking, including a quarter of respondents who reported as self-employed. As the survey sought up-to-date information about firms, only responses from employed respondents are considered in the survey results, unless otherwise indicated. A future survey might consider a different set of questions for retired and unemployed respondents.
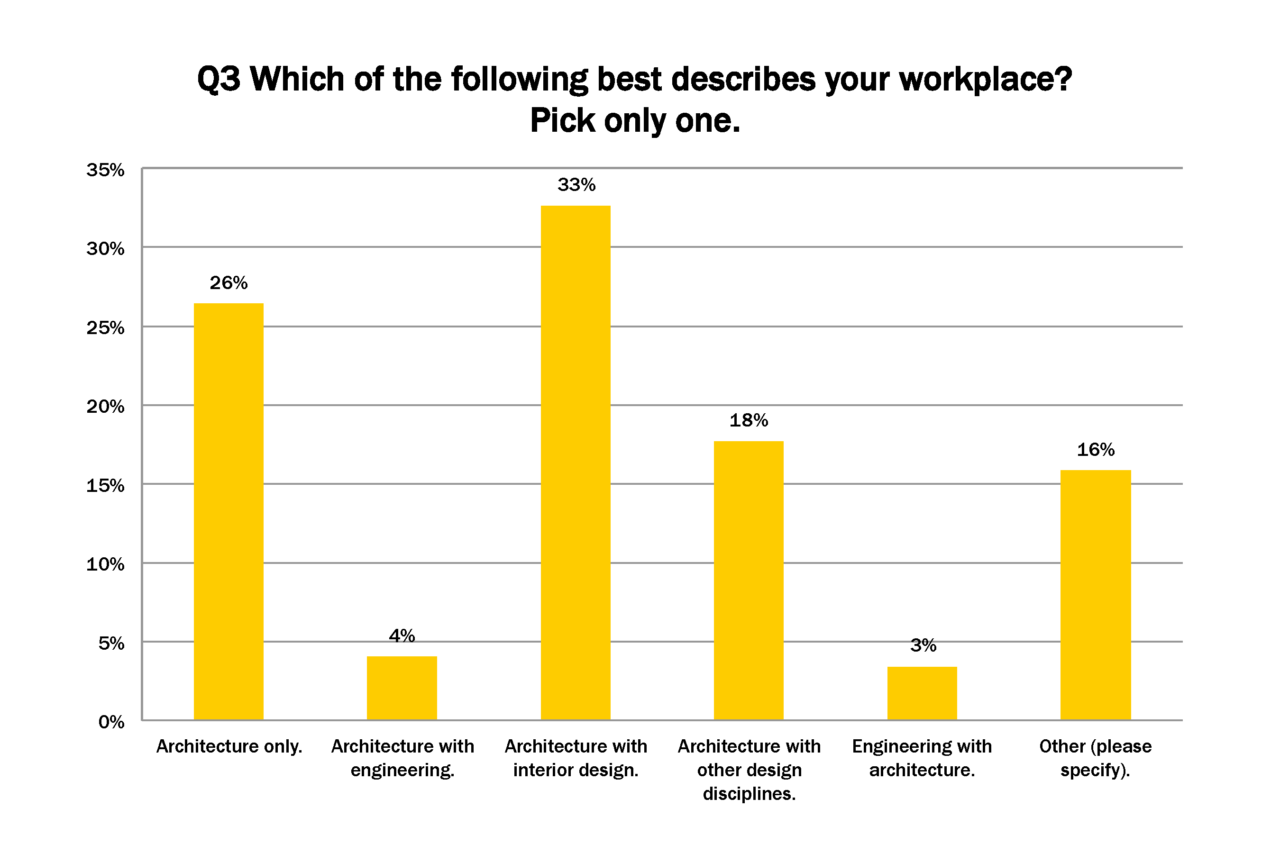
One quarter of respondents reported that their workplaces perform architecture only. Most respondents’ workplaces encompass architecture combined with one or more other disciplines. Some respondents’ work in allied disciplines (next slide).
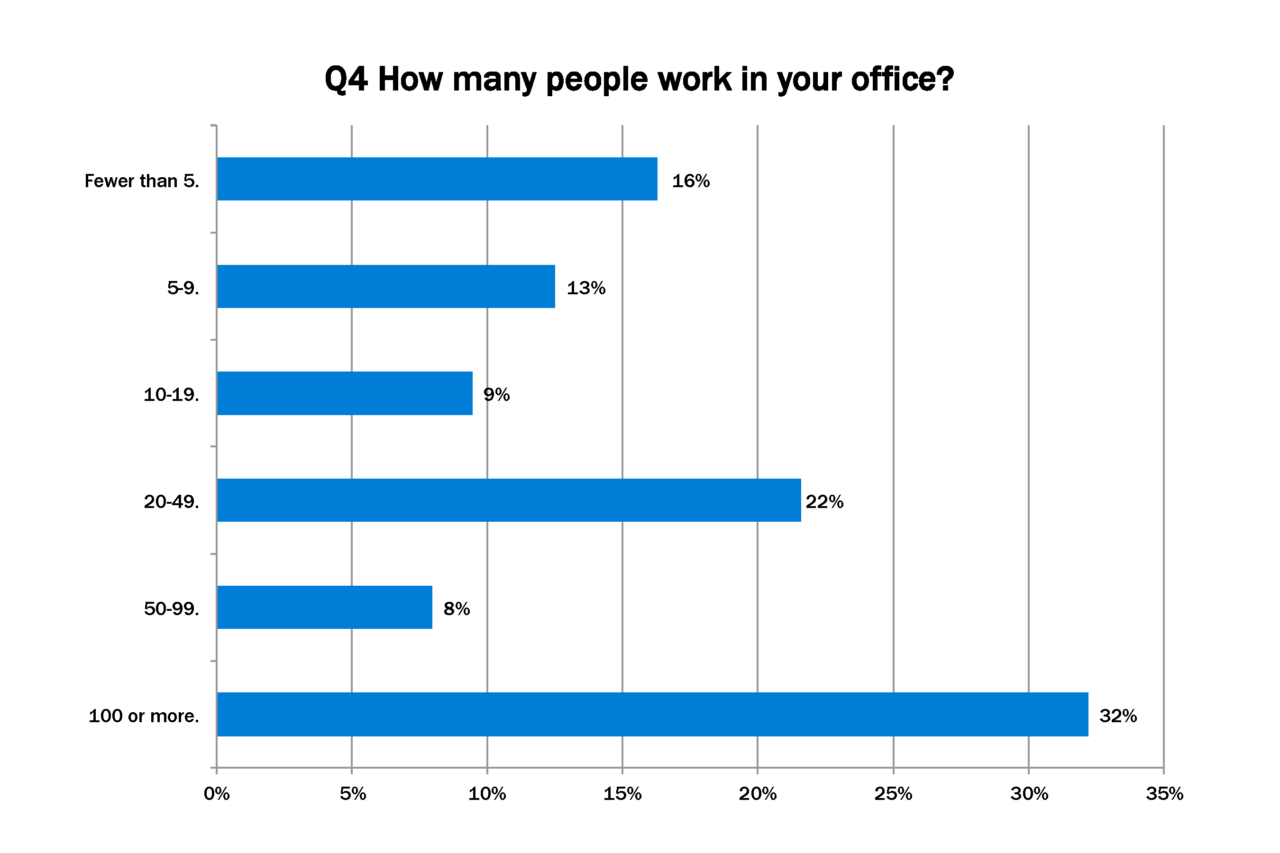
About one third of respondents reported that they work in firms smaller than 20 people. About one third work in firms sized 20-99. About one third worked in firms sized 100 people or larger.
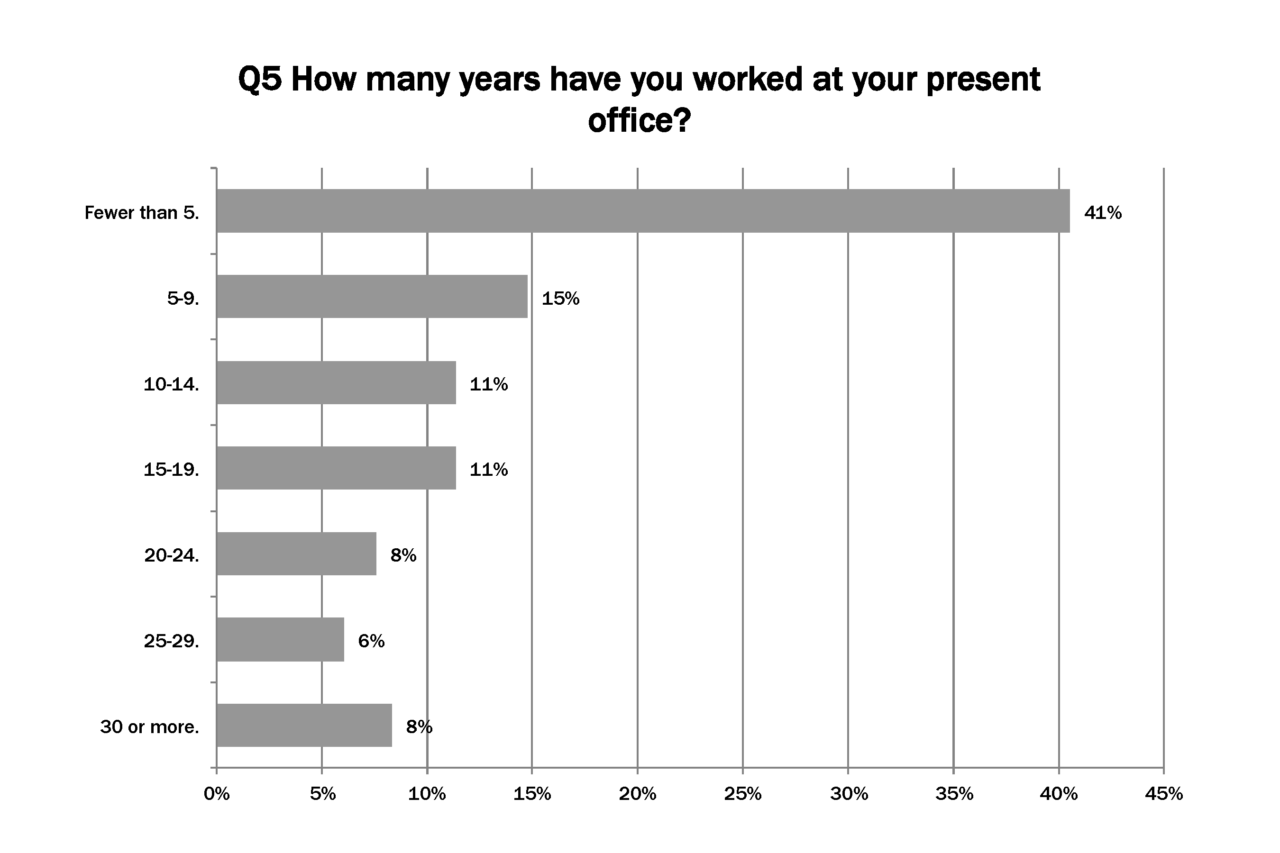
More than half of respondents reported that they have worked at their present workplace for less than 10 years. Of these, most have fewer than 5 years tenure. Respondents averaged 11 years in their current workplace.
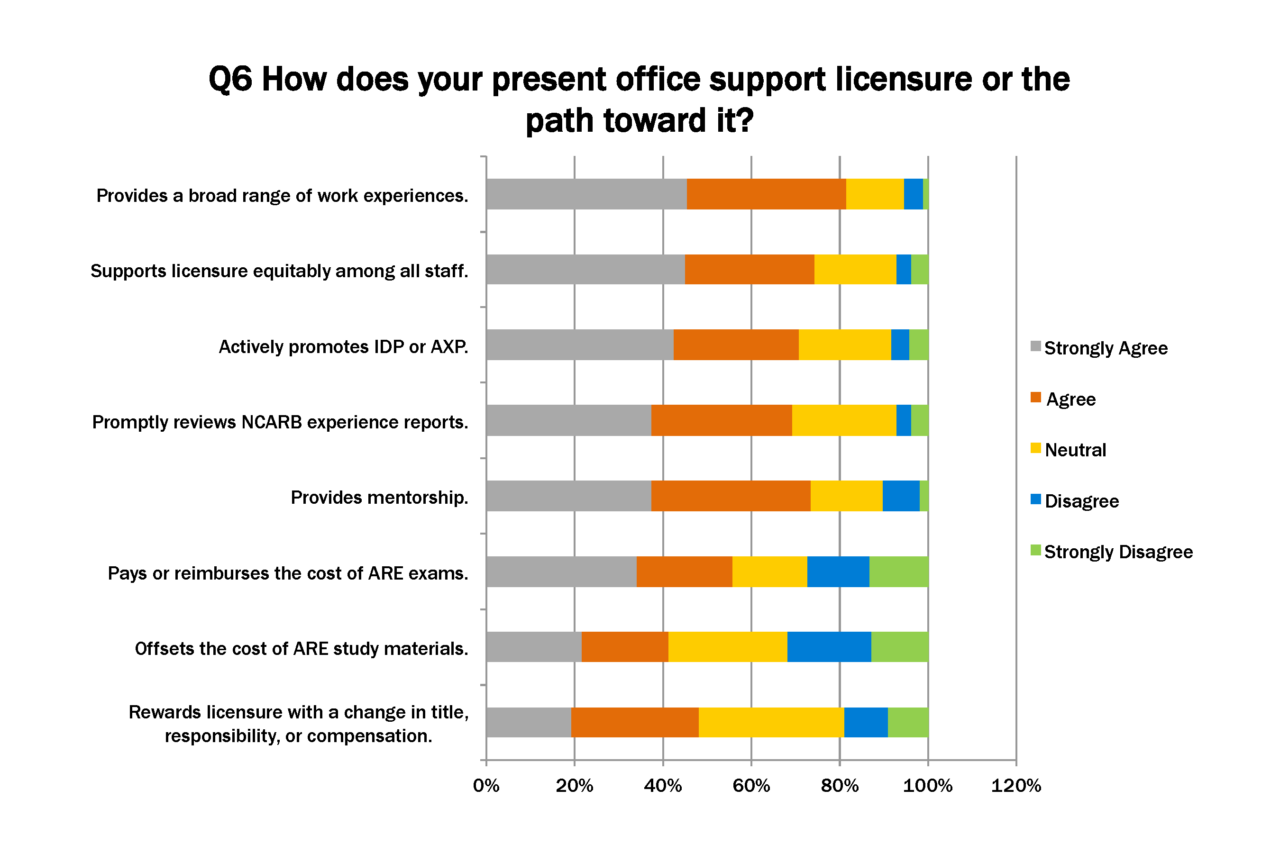
Most respondents agreed that firms generally supported licensure and the path toward it in a variety of ways. Respondents reported more ambivalence about their firm’s financial support in the course of licensure, and about measurable rewards once licensure was attained.
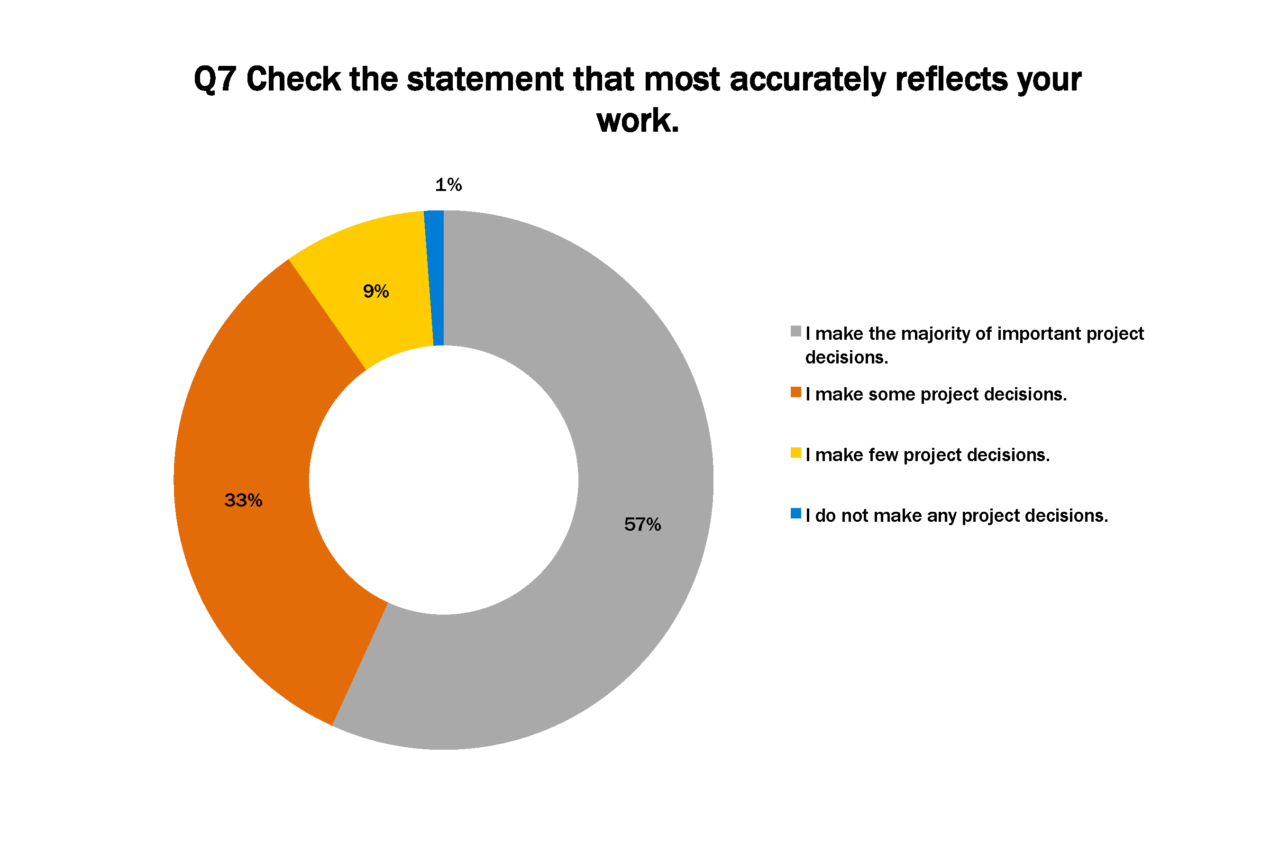
90% of respondents reported that they are decision-makers on their projects.
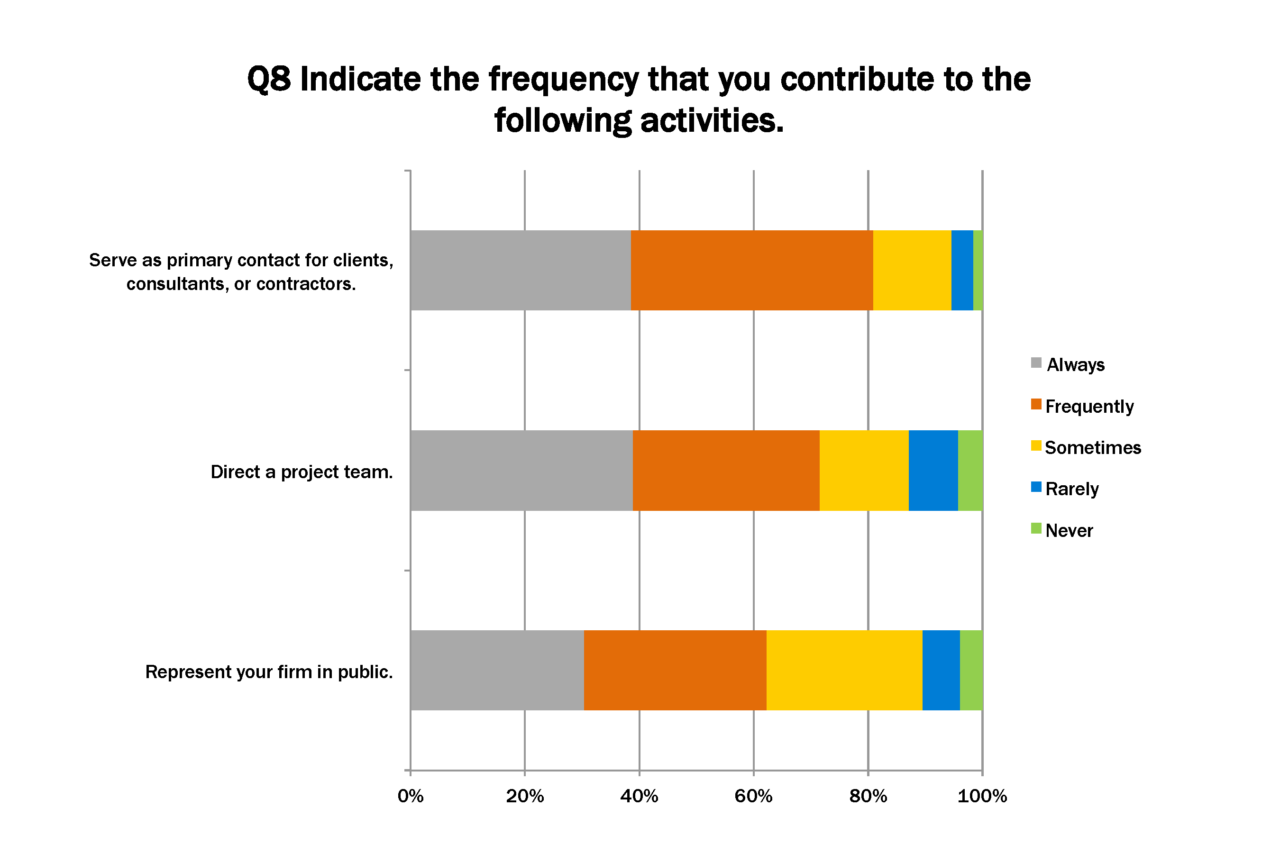
About 80% of respondents reported that they always or frequently served as a primary contact on projects. About 70% reported that they always or frequently directed project teams. About 60% reported that they always or frequently represent their firm in public, although another 20+% reported that they sometimes represent their firm.
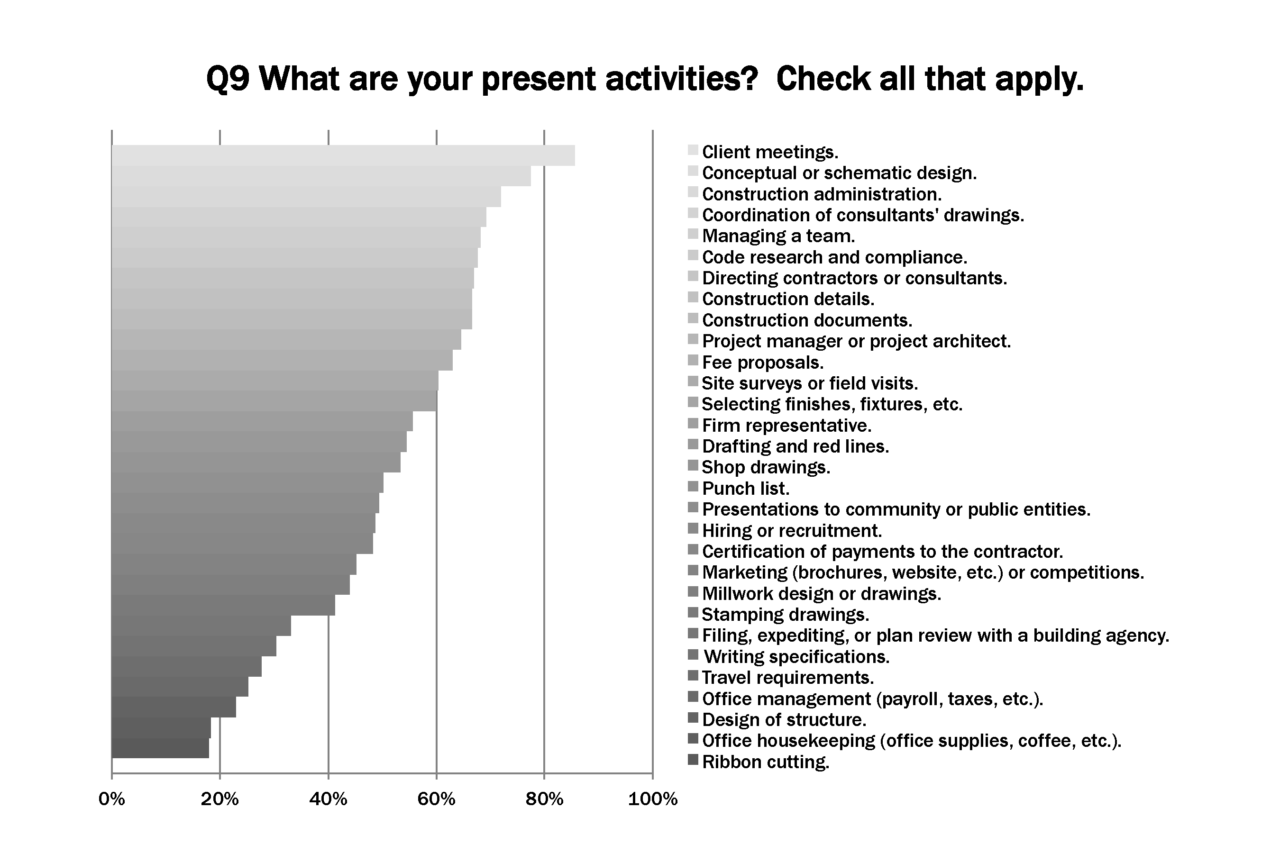
Respondents reported their top activities as client meetings; SD; ConAd; drawing coordination; and team management. Least partaken activities were ribbon cutting; office housekeeping; structure; office management; and travel requirements. Respondents reported 16 activities on average (among 30 options provided). A future survey might include a more direct question about responsibility level (intern, junior, intermediate/associate, project architect, principal/owner).
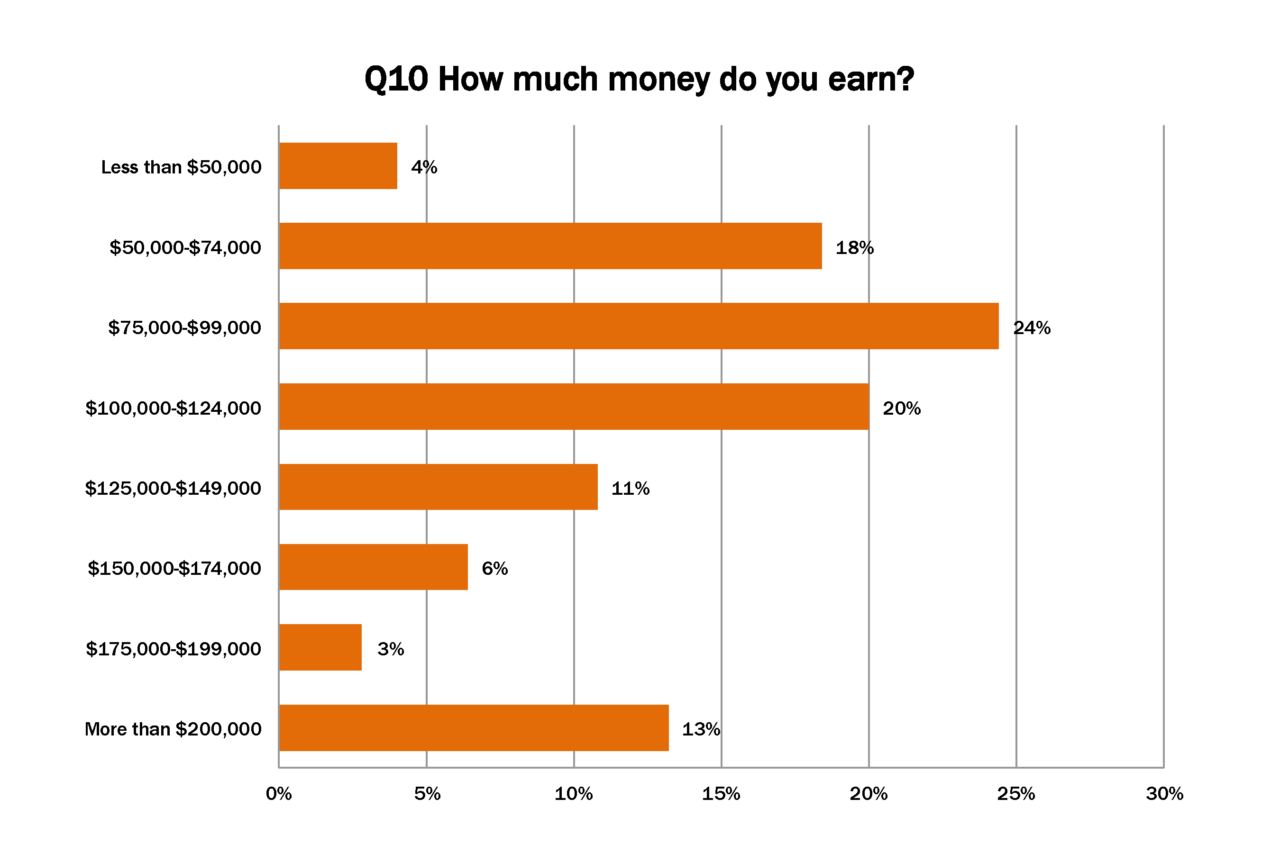
Nearly a quarter of respondents reported earnings in the range of $75,000-$99,000, with a drop above $125,000. More than 10% of respondents also reported earning more than $200,000.

More than half of respondents reported that they have not considered leaving the profession. A third reported that they considered leaving, and nearly 10% reported ambivalence.
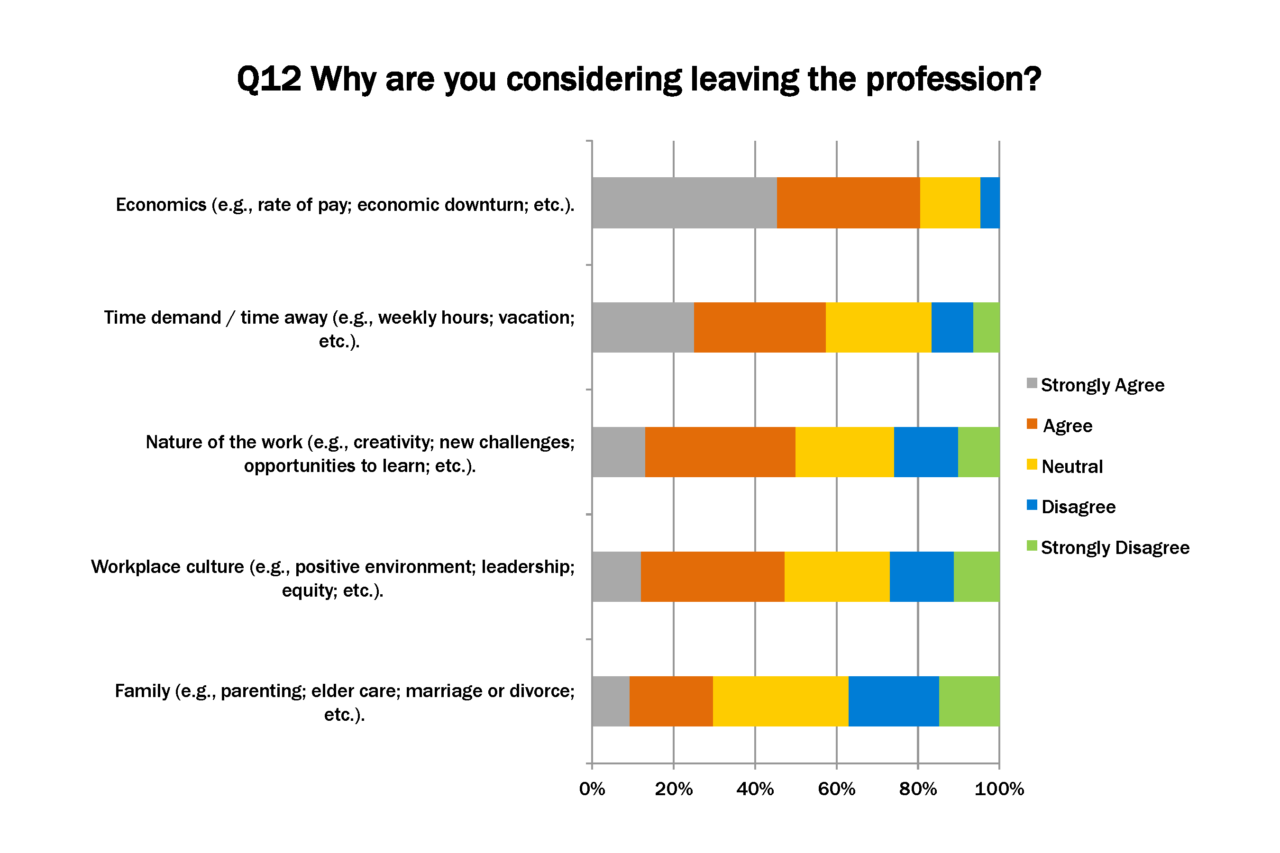
80% of respondents agreed that economics are a reason to consider leaving the profession. More than half agreed that time demand was a reason. Respondents were less agreed upon and more ambivalent about other reasons—the nature of the work, workplace culture, and family.
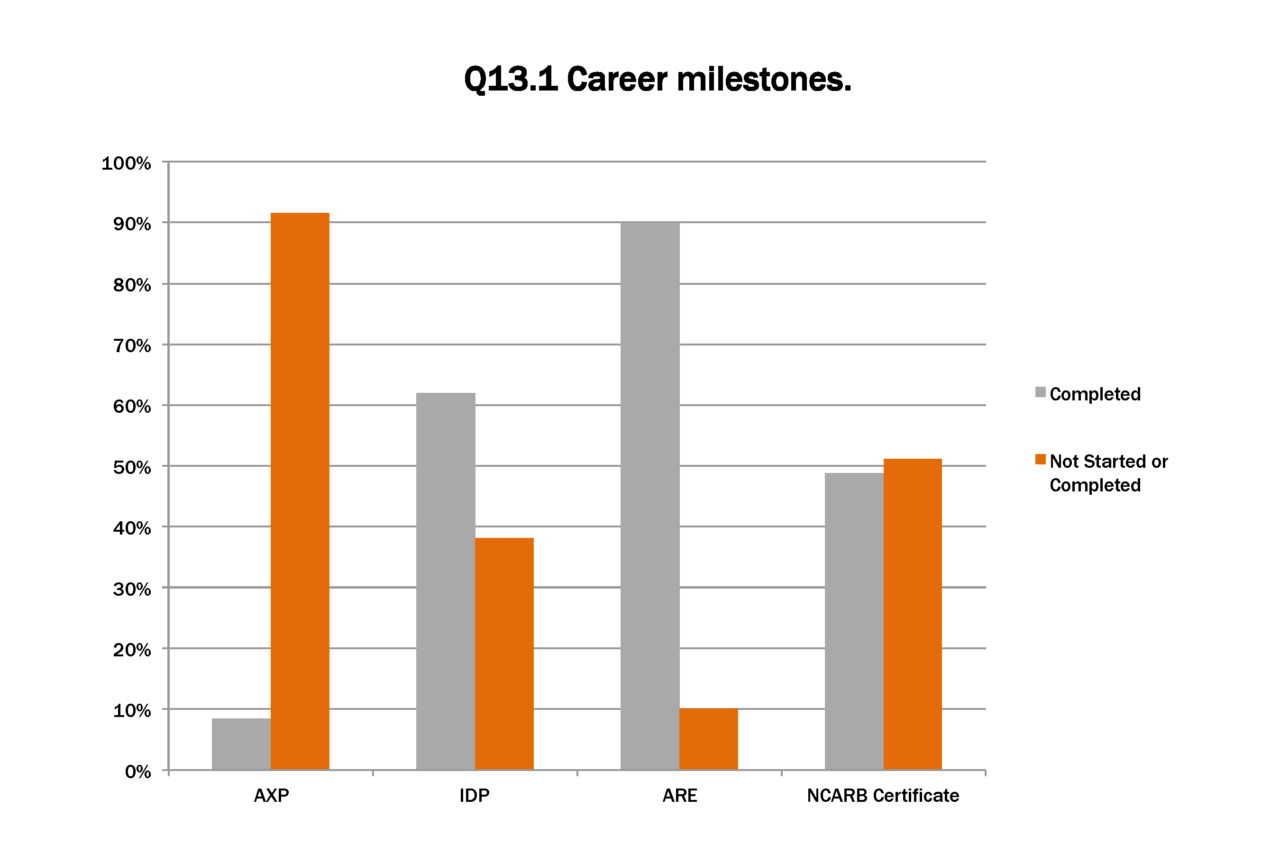
90% of respondents had completed the ARE. About half had completed NCARB Certificate. 70% combined had completed either IDP or AXP.

Of respondents who completed IDP, most spent three years, with 85% completing the program within five years. Of respondents who completed the ARE, 70% did so within three years. Of respondents who attained NCARB certification, 40% met the requirements within 1 year.

295 respondents reported earning 473 academic degrees, an average of 1.6 each.

About 60% of the degrees that respondents reported earning were professional (B.Arch, M.Arch1, or M.Arch2). A greater number of graduate professional degrees were reported than undergraduate professional degrees (by 3 percentage points). A quarter of degrees earned were bachelor’s degrees (non B.Arch).
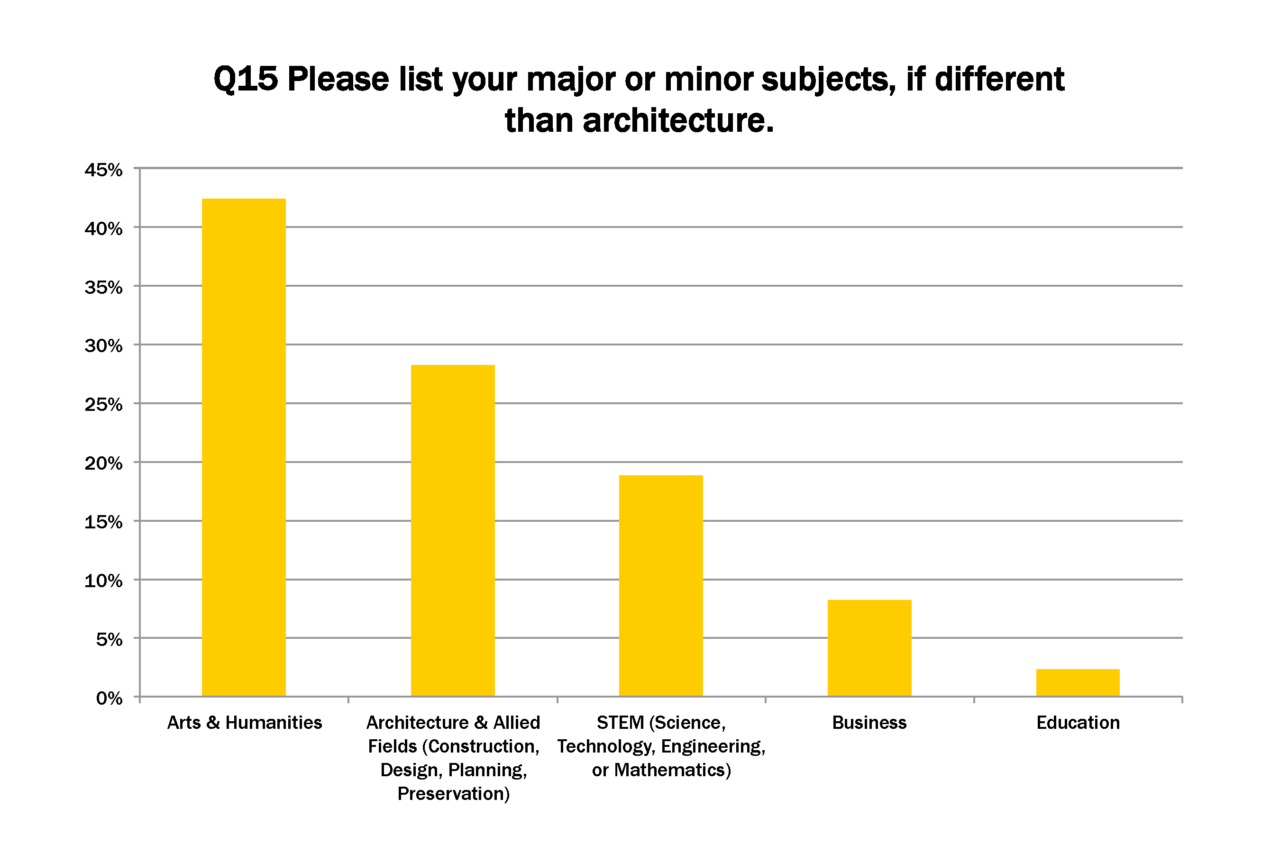
Over a quarter of non-architecture graduates turned out to have backgrounds in architectural studies or allied fields. The majority of concentrations were reported in the arts and humanities.
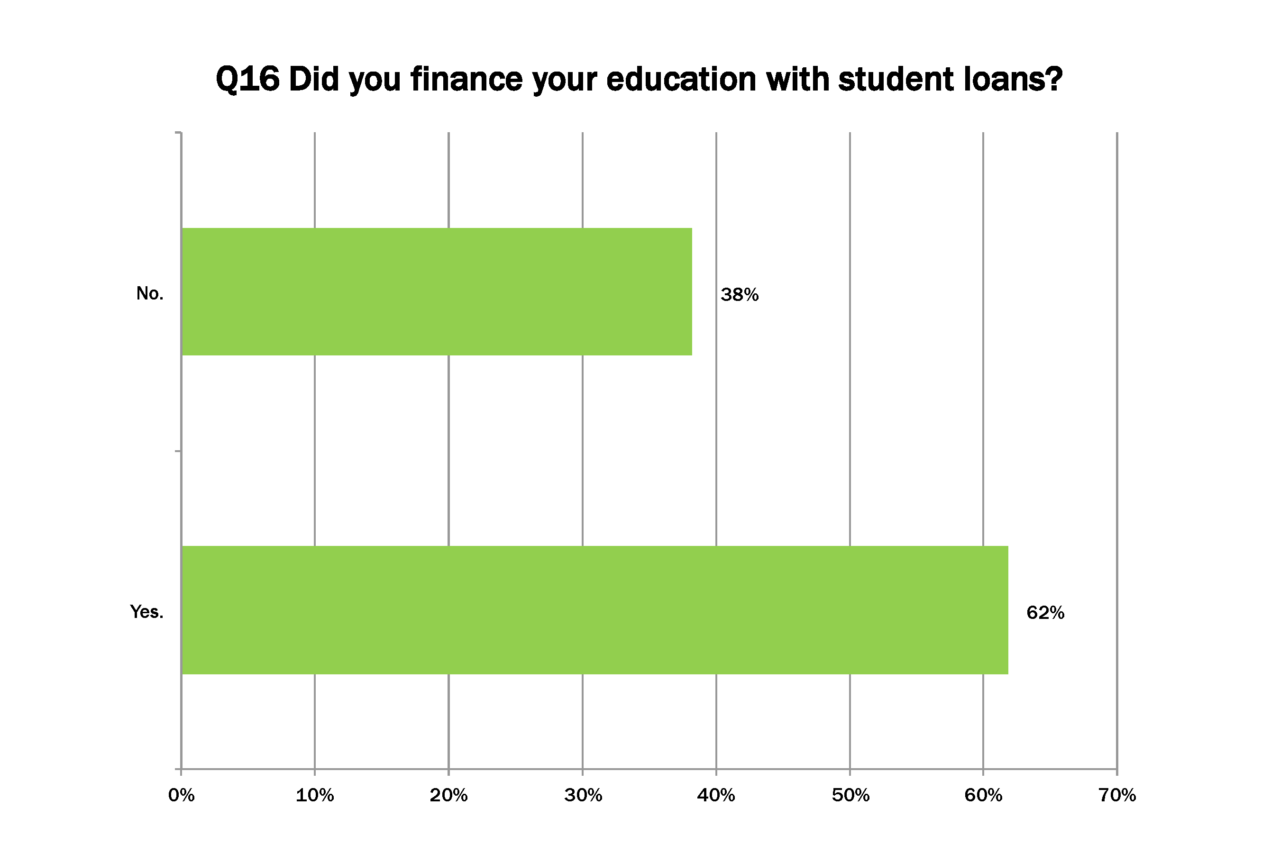
More than a third of respondents did not take student loans to finance their education.

Of the respondents who had taken student loans to finance their education, more than half owed no balance.
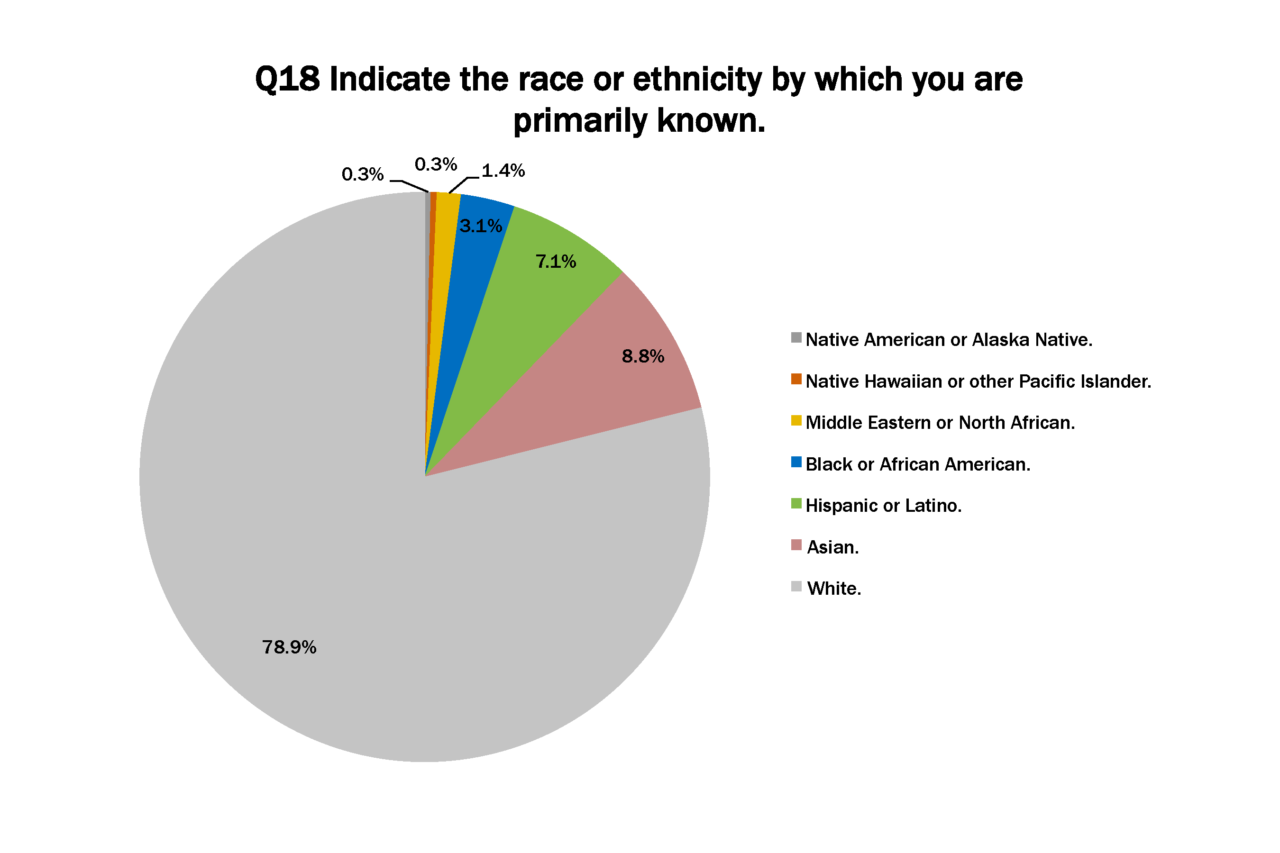
9% of respondents identified as Asian, 7% identified as Hispanic or Latino, and 3% identified as Black or African American. 79% identified as White.

10% of respondents were aged under 30, half were aged in their 30s and 40s, and 40% were older than 49. The average age was 48.
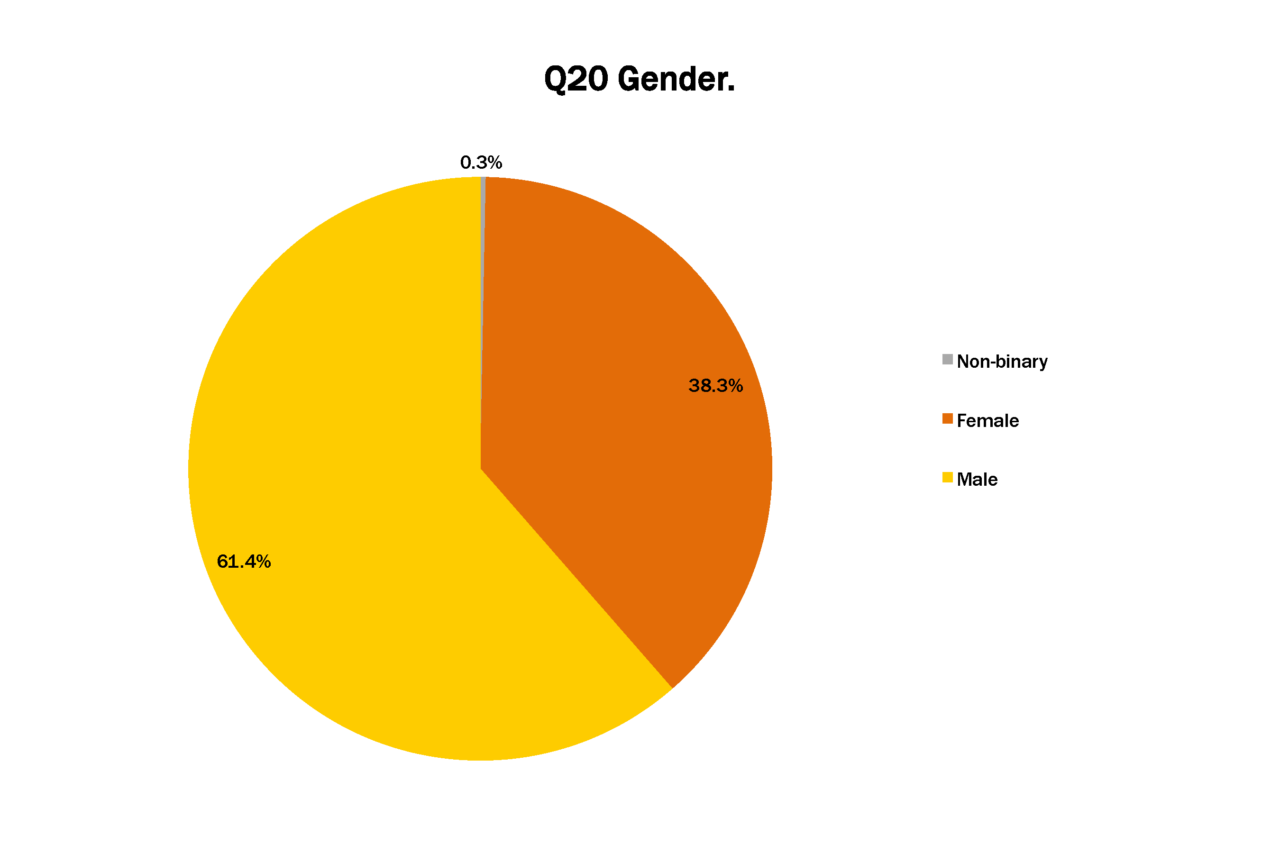
38% of respondents were female, and 62% were male. This question was not asked of respondents, but data was gathered via correlation with respondents’ AIA membership numbers. A future survey might change the way demographics data is gathered, and the order in which demographics series questions appear relative to other topics.
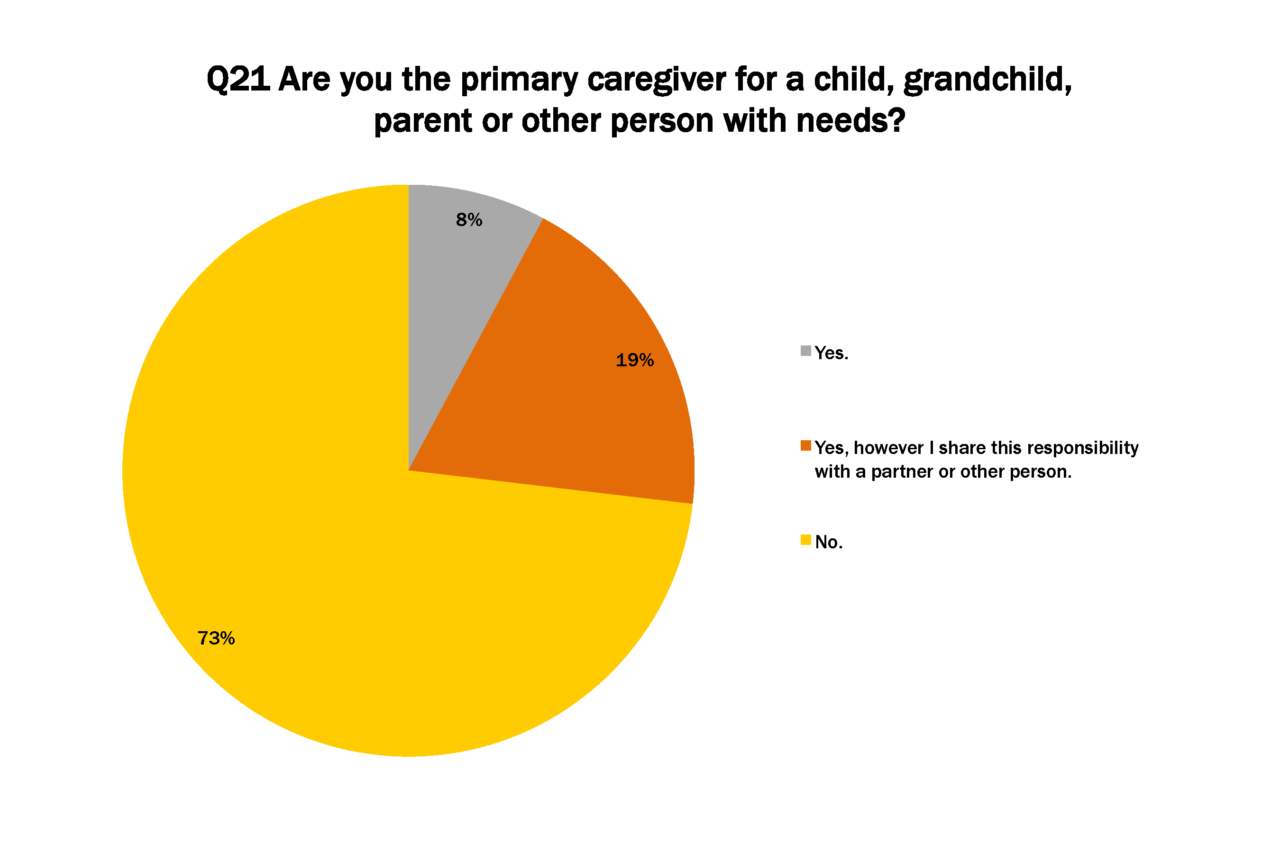
Less than 10% of respondents identified as sole caregivers, while twice as many identified as sharing the responsibility of caregiving with a partner or other person. Almost three quarters of respondents said that they were not caregivers.