


by: Ivan Himanen, AIA, and Tiana Howell, Assoc. AIA, NOMA


By Ivan Himanen, AIA, and Tiana Howell, Assoc. AIA, NOMA
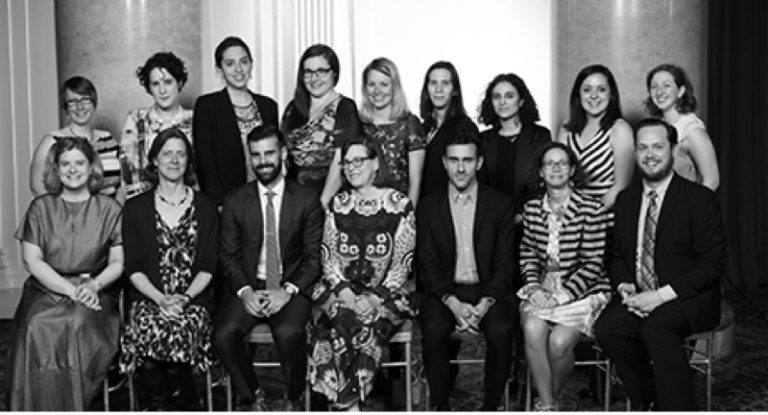
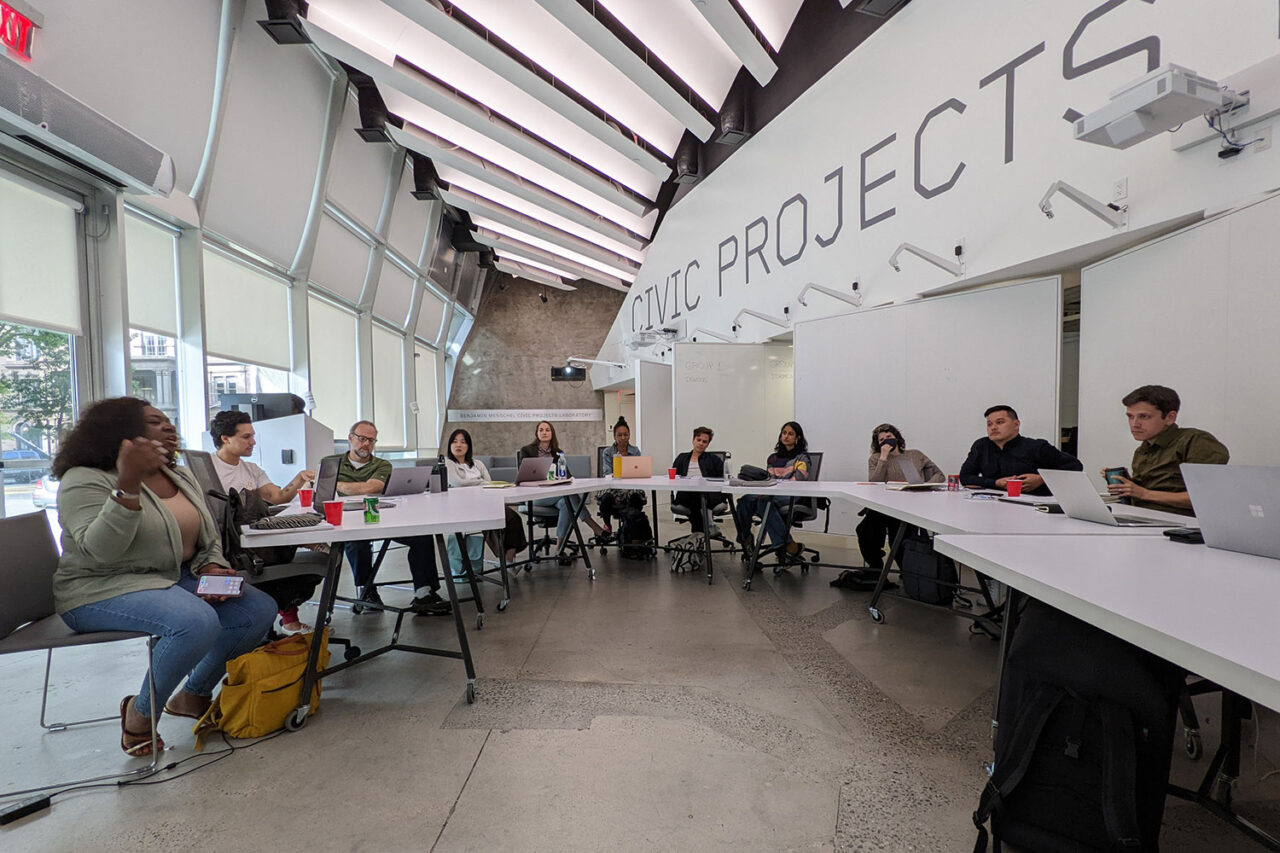
On Friday, September 15, the 2023 class of the AIANY Civic Leadership Program (CLP) hosted their fourth development session, organized by Ivan Himanen, AIA, and Tiana Howell, Assoc. AIA, NOMA. The session focused on data in architecture and planning—a previously under-discussed topic within the CLP.
Why Data?
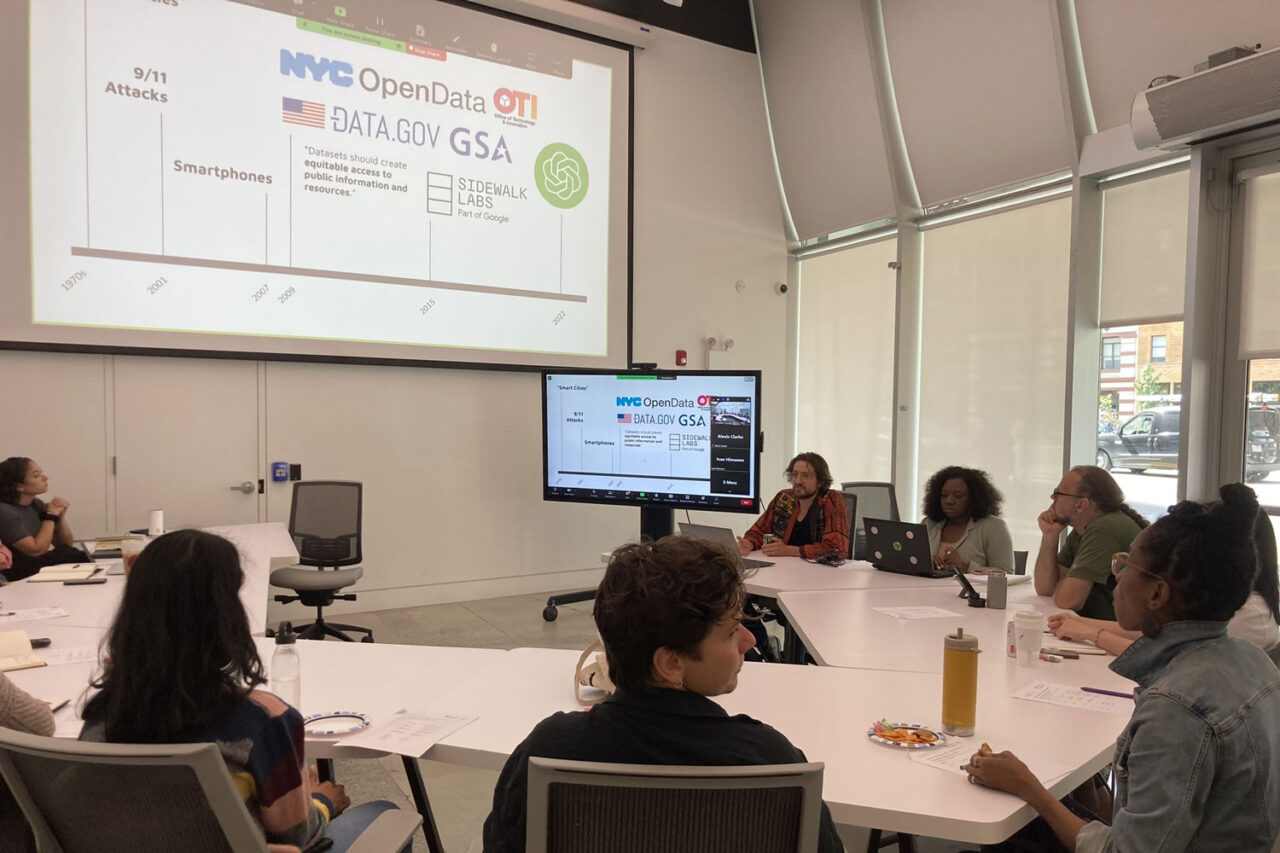
The development session began with the civic leaders presenting a selected history of urban data use, from the advent of “smart cities” to NYC launching its Open Data platform in 2009 and the complex balance of insight versus privacy. Nowadays, a person is as likely to have access to millions of data points as they are to be a data point themselves.
Part 1: Data Literacy
The session began with Sam Keene, professor of electrical engineering at The Cooper Union, discussing his interdisciplinary pedagogy. His Data Science for Social Good course partners with NYC nonprofits, collecting their data and visualizing them to reveal insights. He also discussed a project that attempted to disrupt a facial-recognition algorithm. Keene then led a conversation with the cohort around identifying inherent biases in data.
Part 2: Data Implementation
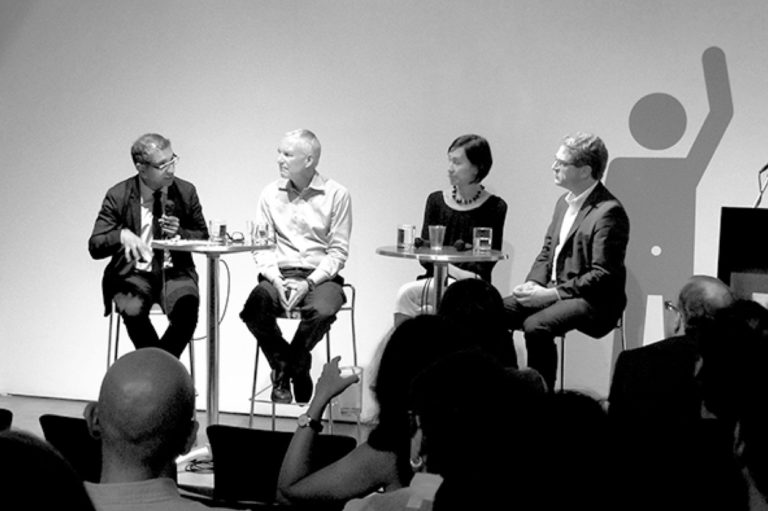
Part 2 was a panel presentation by James Piacentini, digital product manager at the NYC Department of City Planning, and Alejandra Zapata, computational designer at Delve by Google. Piacentini showcased the Equitable Development Data Explorer (EDDE), an online map that visualizes displacement risk across NYC based on demographic and housing data available on the NYC Open Data Portal. EDDE is part of a larger citywide effort to embed inequality awareness in planning, including new mandates for Racial Equity Reports under Local Law 78 of 2021. Piacentini then led a conversation about the use of EDDE to empower local stakeholders in the planning process, scaling the notion of inherent bias up to city government.
Zapata showcased the generative planning tool by Google called Delve, which generates dozens of schematic “massings” for a mid-size planning project based on user inputs like zoning rules, use types, sustainability goals, and financials, improving the efficiency of early stages in the real estate development lifecycle. Google is currently tailoring it for use in the private and public sector. The ensuing Q&A focused on the contrast between developing data-based tools by governments versus tech companies, and how these tools might impact the role of the architect and planner.
Part 3: Data Advocacy
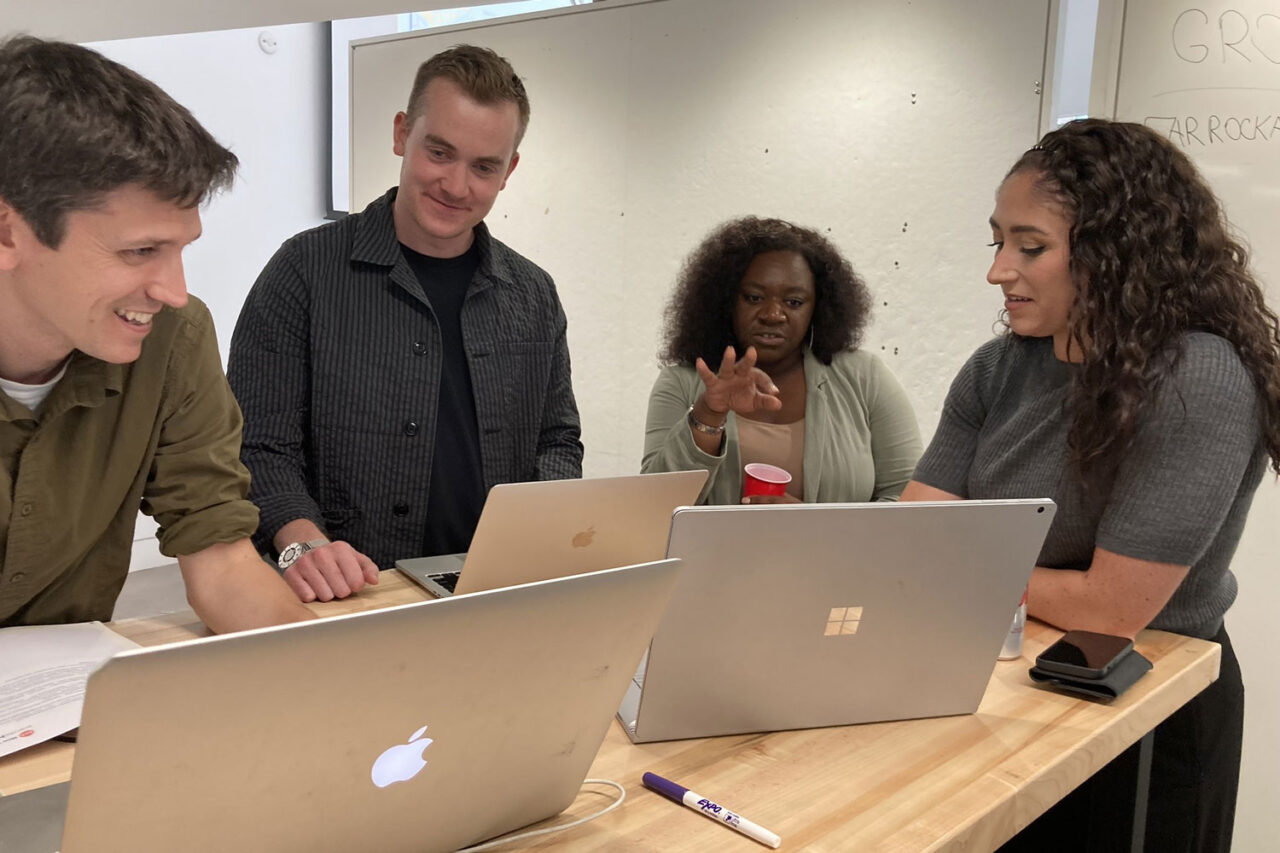
For Part 3 the cohort split up into groups and tested the tools live using the following framework:
You are a planner with a +/-2-acre site in one of 5 recently rezoned neighborhoods in NYC: East New York (Brooklyn), Jerome Avenue (The Bronx), Inwood (Manhattan), Downtown Far Rockaway (Queens), and Bay Street (Staten Island). Use Delve to propose a development on the site. Use EDDE and DCP’s Rezoning Commitments for that area to inform which design scheme you select.
Coming back together, the group discussed how the information from EDDE and the Rezoning Commitments changed each group’s preferred scheme compared to Delve’s Top 3. Howell and Himanen highlighted other NYC-based organizations that use data visualization to promote equity, including Transportation Alternatives’ Spatial Equity and BetaNYC’s BoardStat. The group reflected once again that “data” always reflects real people and communities, that generative tools always benefit from more context, and that learning the basic structure of datasets can help us insert ourselves into the process more proactively.
The Civic Leadership Programs gives special thanks to:
Kate Nicholson, BetaNYC
Dana Chermesh, InCitu
Kasey Motley, CLP Advisor
Jenna Wandishin Reichberg, CLP Advisor
Bradley Sherburne, CLP Advisor
Harriet Provine, CLP Advisor
Ankita Nalavade, CLP Advisor
Iyatunde Majekodunmi, CLP Advisor
Suzanne Mecs, Center for Architecture
Security & IT Staff at 41 Cooper Square, The Cooper Union