


by: Kathy Kia LEED AP

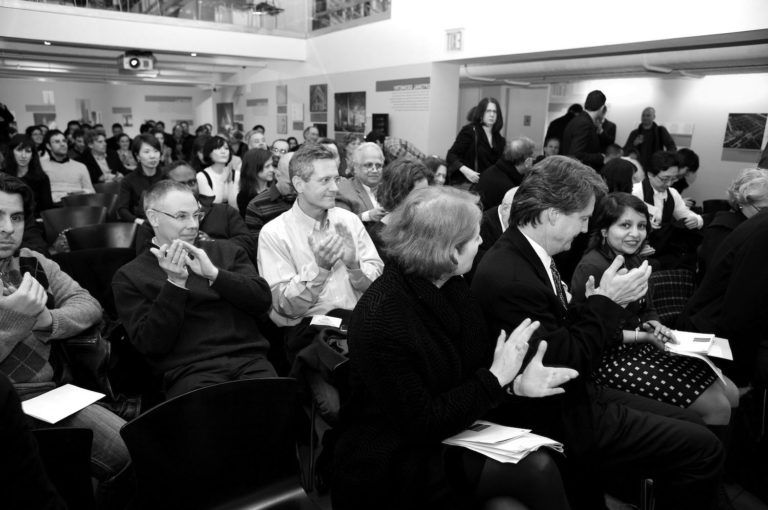
Event: Mapping Risks
Location: Center for Architecture, 07.21.11
Panelists: Dave LaShell — Senior Account Executive, Environmental Systems Research Institute; Dorothy Nash — Senior Associate, Geospatial Technologies, Office of Emergency Management; Alan Leidner — Northeast Regional Information Exchange Broker, U.S. Department of Homeland Security
Moderator: Illya Azaroff, AIA, LEED AP — Assistant Professor, New York City College of Technology & Co-chair, AIANY Design for Risk and Reconstruction Committee
Organizers: Center for Architecture; cultureNOW; AIANY Design for Risk and Reconstruction Committee
Sponsors: ABC-Imaging; Partners: Betaville-Brooklyn Experimental Media Center; Center for Urban Research — City University of New York; Google; New York Public Library; Spatial Information Design Lab — Graduate School of Architecture, Planning & Preservation at Columbia University; Wildlife Conservation Society; Tauranac Maps; The Environmental Simulation Center; Special Thanks: Dattner Architects; The Mohawk Group; Karastan

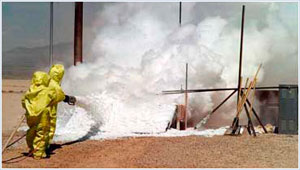
The Office of Emergency Management tracks all forms of potential disaster.
Office of Emergency Management
The numbers are striking. Approximated by the United Nations and Doctors Without Borders, in 2010 alone, 50 million people worldwide have been displaced due to natural disasters, and 42 million have been displaced as a result of manmade disasters. By 2020, the total estimate comes to more than 200 million. It is with the aid of new mapping tools that we can track potential risks and preventative measures beyond past cartographic methods. Architects, urban planners, designers, engineers, sociologists, and archeologists can all contribute to mapping the potential risk of an area as they have the ability to pull together information from hundreds of databases and on-site research.
One of the city’s main hubs of information is the Office of Emergency Management (OEM), a “small agency, big mission”, said Dorothy Nash, a senior associate of geospatial technologies at the OEM. The organization is responsible for a 24/7 “watch alert” system to respond and report any abnormal circumstances in the city. Whether it is high heat effects or a public event requiring a representative to be on site, the OEM uses GIS maps to monitor everything, including the number of 311 calls, tracking sewage paths and public waterways, and to alert public management agencies about notable events. It is unlikely there is an area above or below ground that OEM does not cover or reference on its maps.
As U.S. Department of Homeland Security’s Alan Leidner put it as “GIS is the DNA of government.” It is a system that takes national, city, town, and street information and relates them to each other. Hundreds of pieces of information are organized and mapped. Perhaps the best example of the effectiveness of GIS is 9/11. A week prior to the disaster, the base map of NYC’s infrastructure was tracked by just one part-time employee. After 9/11, the effort multiplied tenfold. Reports were pouring in by the hundreds, and only with the efforts of volunteers from public and private sectors was it possible to pull together the means of specialized maps for specific emergency needs within hours of the request. GIS is carving the path in which we communicate as a community, and it is becoming a necessity for assessing preventative measures — the halo of risk management.
Kathy Kia, LEED AP, is a NYC-based architectural designer and freelance writer.